 Home › Programs › Vanilla › Walkthrough › 05. Using Statistics
Walkthrough: Using Statistics
To use the statistics functionality in Vanilla, first of all select the "Statistics"
tab in the window:
this brings up the Statistics Panel:

The Default Statistics Panel
The Statistics tab is a great way to visualise how your data is broken up. For this
walkthrough we'll use the Sample List and run through each of the Statistics. The
first thing you need to do before you can get any statistics, is to press the "Generate
Stats" Button:
Once you press the "Generate Stats" button, you will notice that all the buttons
on the bottom of the statistics panel will be enabled:

The buttons on the bottom of the Statistics Panel are enabled now
Let's now start clicking. First click the "By Type" Button. This will result in
the following graph:
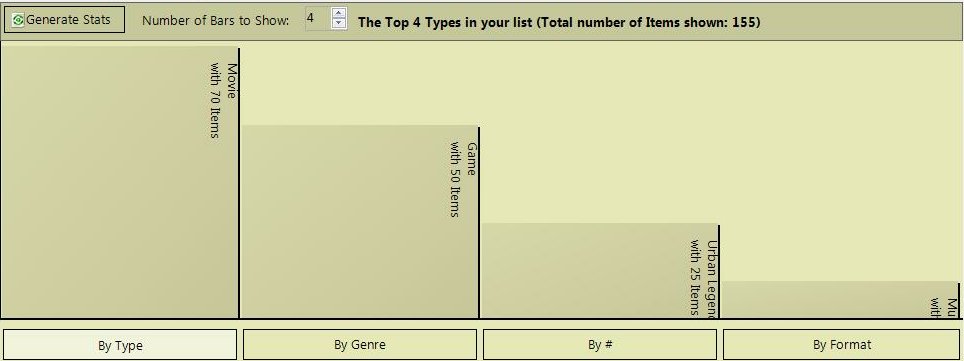
Clicking the "By Type" Button
What does the graph mean? This graph visually shows you the breakdown of all the
different Types that are in your List. As you can see, in the Sample List, there
are four types, with "Movie" containing 70 items, followed by "Game" with 50. If
you hold your mouse over the graph, Vanilla will show you the details of the bar
that your are on. Let's get on to the next Statistic, and show you another nice
thing you can do. Let's press the "By Genre" button. Doing so will generate the
following graph:

Clicking the "By Genre" Button
As you can see, there are a few more bars to this graph! By default, Vanilla will
display up to 10 bars. You will notice on top of the Statistics Panel, there is
a slider named "Number of Bars to Show". Let's change that to the maximum Vanilla
will generate (This is dependant on the number of categories that you actually have
- for example, if you have only 17 categories, then 17 will be the maximum that
you will be able the choose).:

When we have reached the limit of Genres (There is a limit of 20 bars as any more
it gets too cluttered!), the graph will look like this
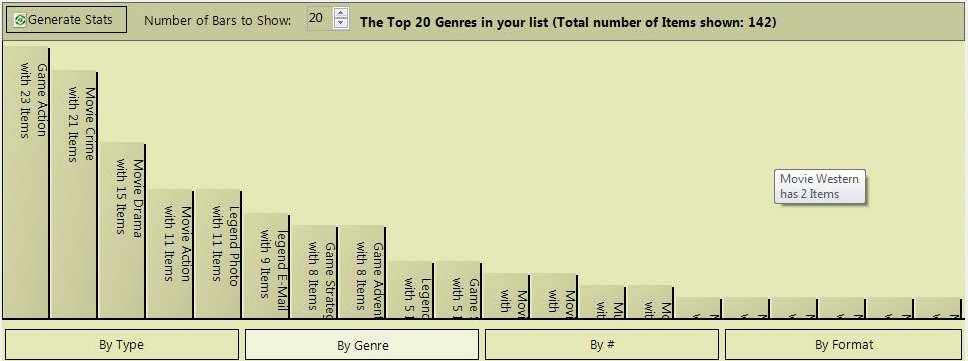
Increasing the Number of Bars
As you can see from above, the Sample List only has 20 Genres in it. As you can
also see, there is a little white box which says "Movie Western has 2 items". This
is what pops up when you hover your mouse over a bar. For the rest of this walkthrough,
will assume the default number of bars. Let's click on the next button, "By #".
The resultant graph looks like this:
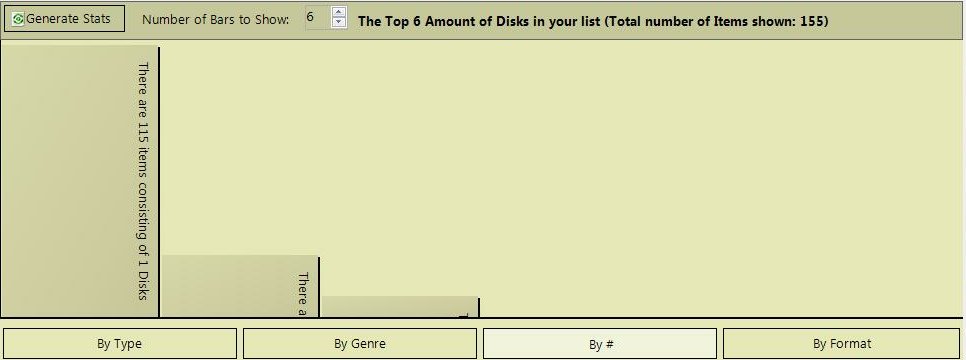
The "By #" Statistics
The above statistics shows you the breakdown of items by the Number of Discs. Depending
on how you make your list, this could be useful. Let's click on the last button,
the "By Format" button. This produces the following graph:
The "By Format" Statistics
Now you can see the breakdown of the different Formats in your List. Once thing
to notice, is that next to the "Number of Bars to Show" slider, there is some text
saying "The Top 10 Formats in your list. (Total number off items show: 137)". As
with the previous graphics, you know that there are 155 record in the Sample List.
This is an indication that there a few more bars that can be added to the list.